Electricity Revenue Loss Analysis (IBEDC ATC&C)
About a third of the revenue from electricity distributed across southwestern Nigeria never makes it back to the distribution company. This project built an end-to-end analytics pipeline to identify exactly where IBEDC's revenue leaks at the feeder level, validate the findings with statistical rigour, and identify which feeder characteristics actually drive the loss.
Project Overview
Built a normalised MySQL schema and a Python statistics + machine learning notebook that decompose feeder-level ATC&C (Aggregate Technical, Commercial & Collection) losses, validate patterns with hypothesis tests and effect sizes, and train a Random Forest model to identify the dominant loss driver.
Dataset
Simulated feeder-level energy and billing data, calibrated to NERC ATC&C performance benchmarks by service band
Key Questions
- Which feeders and regions carry disproportionate revenue loss, and is the pattern concentrated or spread evenly?
- Is the relationship between metering rate and ATC&C loss real, linear, and practically significant — not just statistically significant?
- Do service bands genuinely differ in loss, or does that pattern collapse under formal testing?
- Which feeder characteristics actually drive loss once non-linear interactions are accounted for?
Methods
- Normalised MySQL schema (feeders, monthly_readings) holding 12 months of feeder-level energy and billing data across 50 feeders and 6 regional hubs
- SQL feature engineering that collapsed 12 monthly rows per feeder into one row per feeder (~50 independent observations), computing billing efficiency, collection efficiency, and the ATC&C loss formula per feeder to avoid violating independence assumptions in later hypothesis tests
- Five SQL data-quality checks (billed vs received, collected vs billed, metered vs total customers, null values, negative values) run before any analysis
- Distribution, boxplot, and scatter visualisation of ATC&C loss by feeder, service band, and hub
- Pearson and Spearman correlation between metering rate and ATC&C loss
- Welch's t-test, Cohen's d, and Mann-Whitney U comparing under-metered vs well-metered feeders split at the median
- One-way ANOVA with Tukey HSD post-hoc, plus Kruskal-Wallis as a non-parametric check, across service bands
- Random Forest regression (80/20 train-test split) to capture non-linear interactions between metering rate, customer base, service band, and hub
Results
ATC&C loss across the 50 feeders averaged 44.2% (median 43.2%) and was right-skewed — most feeders performed reasonably, but a tail of severe under-performers pulled the average up, meaning the problem is concentrated rather than uniform. Metering rate correlated strongly with loss (Pearson r = -0.939, p = 7.7e-24). Under-metered feeders lost 59.5% of revenue on average versus 28.9% for well-metered feeders (Welch's t = 8.16, p = 1.3e-10, Cohen's d = 2.31 — a very large effect, confirmed non-parametrically with Mann-Whitney p = 5.0e-08). Loss also differed significantly across service bands (ANOVA F = 42.95, p = 8.1e-15), with Tukey HSD confirming nearly every band pair differs except D vs E. A Random Forest regression explained 85.6% of the variance in ATC&C loss (R² = 0.856, MAE = 0.055), and metering rate alone accounted for 90.6% of feature importance — dwarfing service band, hub, and customer count combined.
Project Pictures
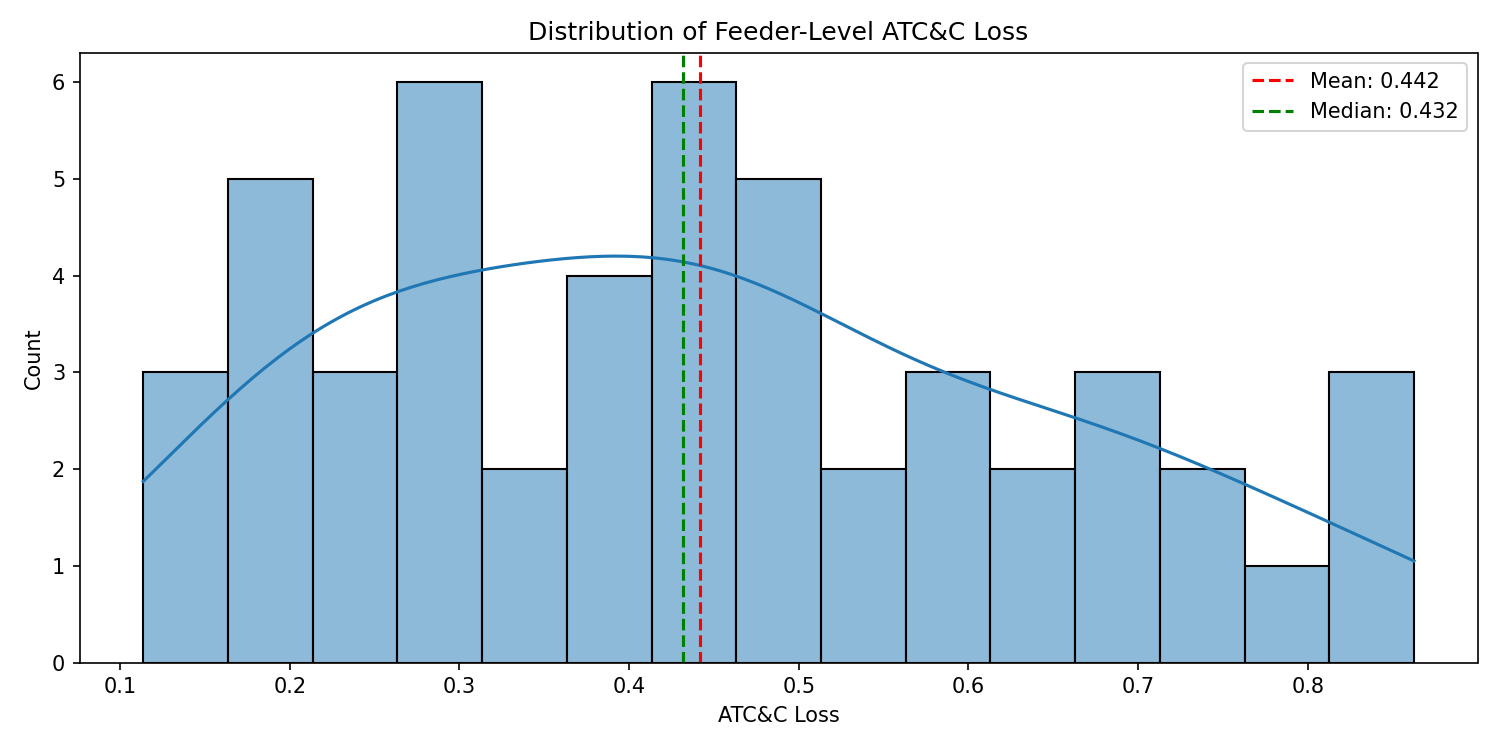
Distribution of feeder-level ATC&C loss — right-skewed, mean 0.442 vs median 0.432
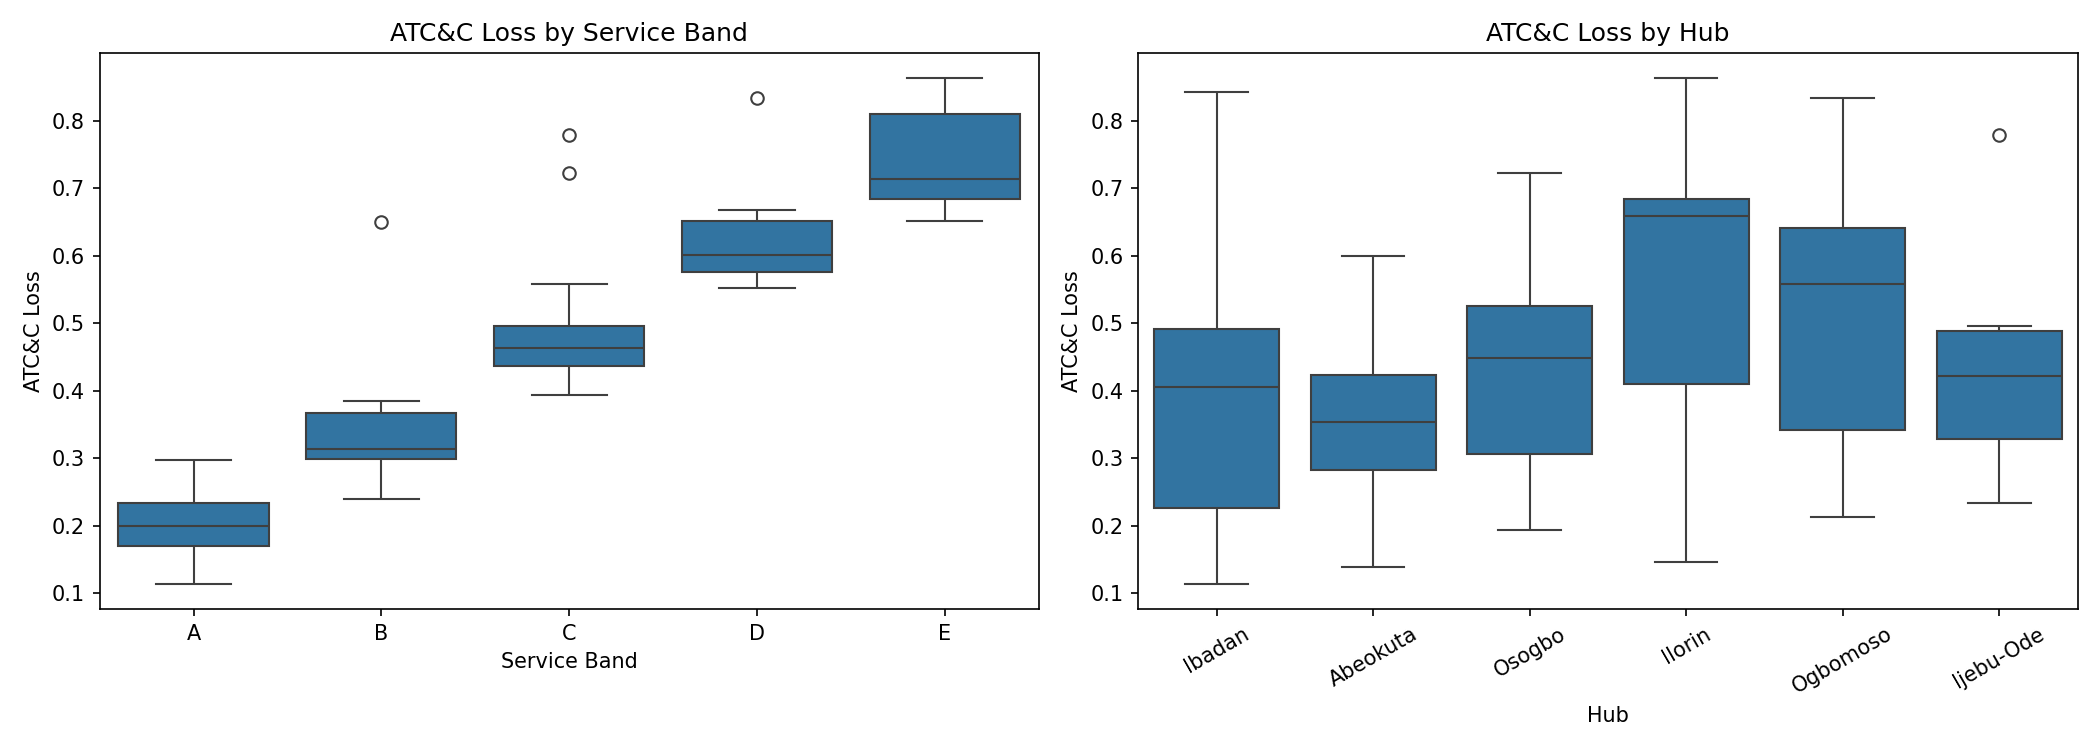
ATC&C loss by service band and by hub
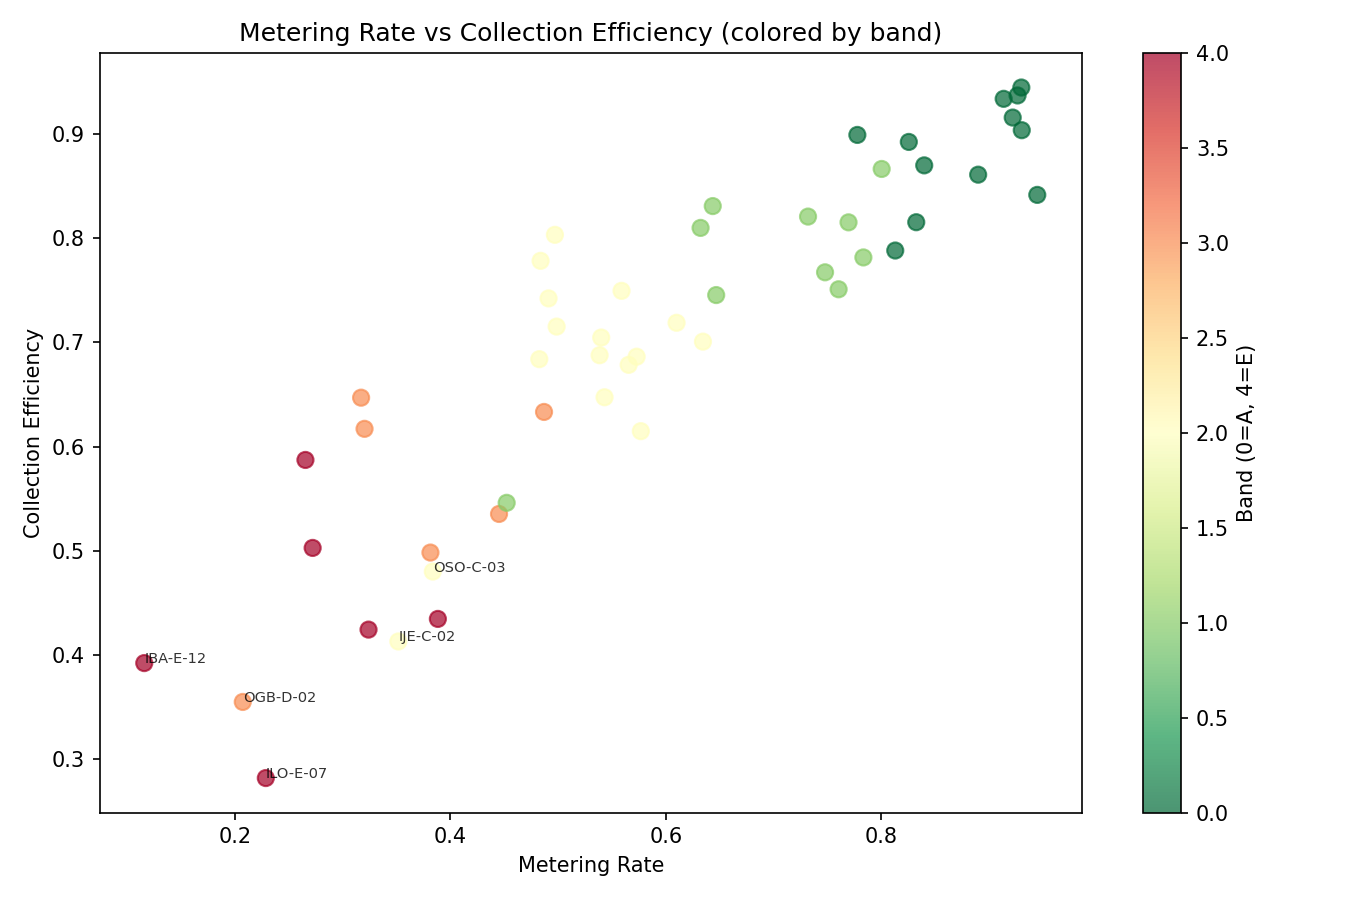
Metering rate vs collection efficiency, coloured by service band, with the five worst feeders labelled
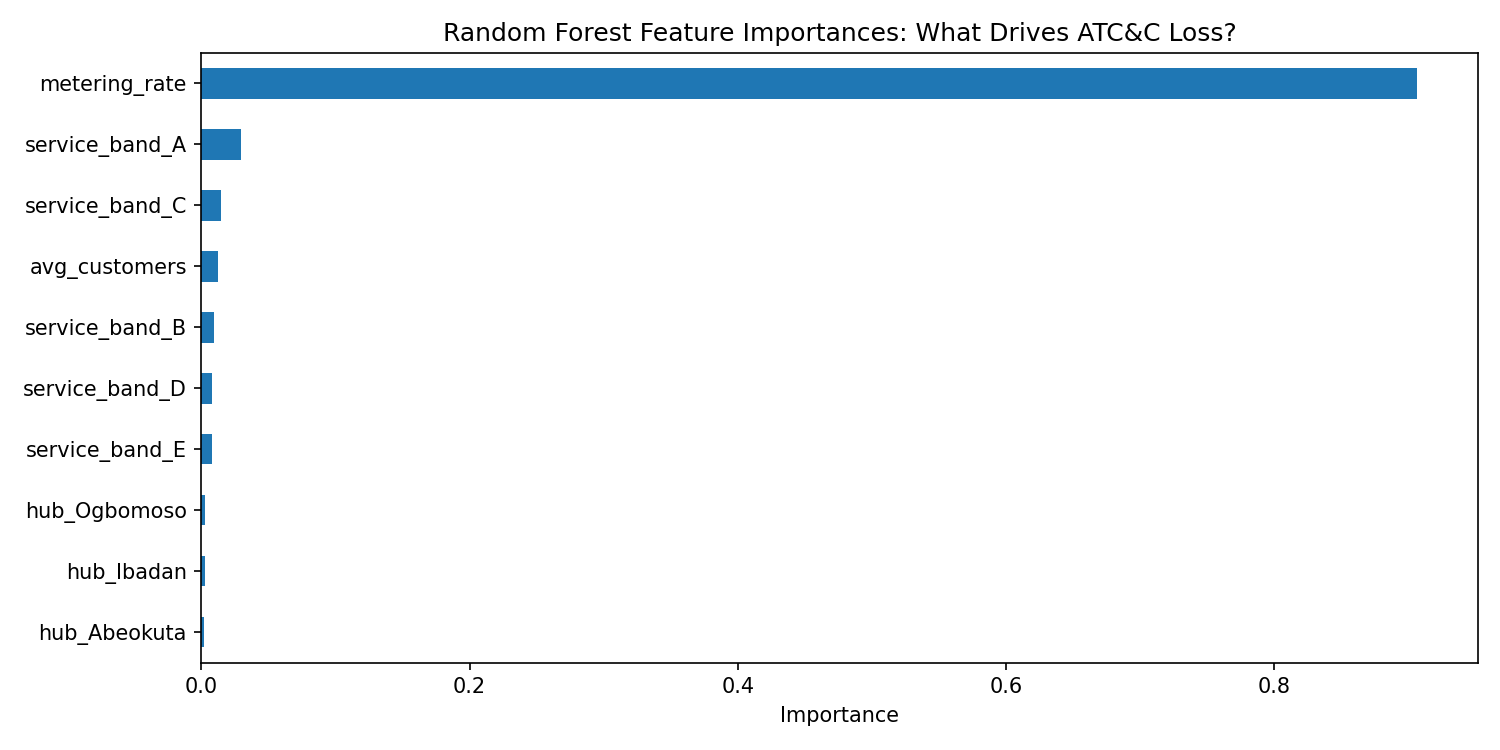
Random Forest feature importances — metering rate dominates at 90.6%
Recommendations
- Treat metering rate as the primary lever: prioritise metering rollout and meter-repair programmes on the worst-metered feeders first, rather than applying blanket upgrades across the network
- Because loss is concentrated in a tail of severe under-performers rather than spread evenly, target interventions at the specific worst feeders the model identifies rather than a uniform policy
- Use service band as a secondary prioritisation signal — bands differ significantly — but not the primary one, since the Random Forest results show hub and band contribute far less than metering rate once interactions are accounted for
- Rebuild the recovery-projection stage to rank feeders by lowest collection efficiency rather than absolute naira lost, since ranking by absolute revenue lost is skewed by tariff differences between bands and produced an invalid recovery estimate in the first pass
Limitations
The underlying feeder and monthly-reading data is simulated (seeded for reproducibility) and calibrated to published NERC ATC&C benchmark ranges by service band, not pulled from live IBEDC systems, so the statistical relationships demonstrate the method rather than a live operational finding. The Random Forest was trained on only 50 feeders (40 train / 10 test), so the R² should be read as indicative rather than a production-grade estimate. A naira-denominated recovery projection was attempted but is being corrected before publication, since the first pass ranked feeders by absolute revenue lost, which conflated tariff-band differences with loss severity and produced a nonsensical negative recovery figure.